
If you are wondering why you should take a data science test, the answer is simple: skills matter. By taking the test, you will:
- know where you stand in the community of AI practitioners
- review your performance to learn about your strengths and weaknesses
- access personalized study plan to prepare for interviews
- fast track to job opportunities within our network
- get a certificate
And, it’s free. Your results are only ever shared with your permission to refer you to a company. Let’s go over the data science test.
I What is the data science test
The data science test is one of six standardized tests that were developed by a team of AI and assessment experts at Workera to evaluate the skills of people working as a Data Scientist (DS), Data Analyst (DA), Machine Learning Engineer (MLE), Deep Learning Engineer (DLE), Machine Learning Researcher (MLR), or Deep Learning Researcher (DLR). It is comprised of multiple choice questions selected from a large database, so that different test takers get different questions, and takes 15 minutes to complete.
You can learn more about these roles in our AI Career Pathways report and about the other tests in The Skills Boost.
II What to expect in the data science test
Before taking a test, it is important to understand what it evaluates and how it is graded. The grading rubric for the data science test includes three categories:
- Using probabilities, which covers probability theory including probability distributions (e.g., uniform, normal, Bernoulli, binomial, Poisson, etc.), operations on probabilities (e.g., sum of probabilities, probabilistic independence, conditional probabilities, etc.), and properties of random variables (such probability density functions or Bayes theorem).
- Using statistics, which encompasses foundational objects and methods from statistics such as statistical parameters (e.g., mean, variance, covariance, mode, etc.), hypothesis testing (e.g. z-test, t-test, A/B test, p-value, etc.), and statistical properties (bias/variance tradeoff, central limit theorem, etc.).
- Analyzing data, which spans data analysis techniques to preprocess data (e.g., clean, transform, augment, or parse), visualize data (e.g., plot, rank, and compare), and use popular metrics (such as accuracy, R-squared, residuals, precision, and recall).
You will be evaluated and assigned to a skill level in each category: beginning, developing, or accomplished, depending on your mastery of the skill at hand. Your skill level in data science will be determined using a combination of your scores across all three categories.
You can learn about the categories and performance levels in the table below.
| Category | Beginning | Developing | Accomplished |
|---|---|---|---|
| Using probabilities | Demonstrates limited understanding of basic objects and methods from probability theory. | Demonstrates ability to use objects and methods from probability theory with some effectiveness. This includes calculating the probability of an event, understanding various probability distributions, and working with random variable and their properties. | Demonstrates ability to apply objects and methods from probability theory to real-world problems and identify their use cases and shortcomings. |
| Using statistics | Demonstrates limited understanding of basic objects and methods from statistics. | Demonstrates ability to use objects and methods from statistics with some effectiveness. This includes understanding hypothesis testing, computing statistical parameters, and statistical properties. | Demonstrates ability to apply objects and methods from statistics to real-world problems and identify their use cases and shortcomings. |
| Analyzing data | Demonstrates limited understanding of working with data. | Demonstrates ability to extract information from data with some effectiveness. This include preprocessing, visualizing, and evaluating metrics. | Demonstrates ability to extract valuable information from data to solve business problems. |
At the end of the test, you’ll see your overall skill category in data science.
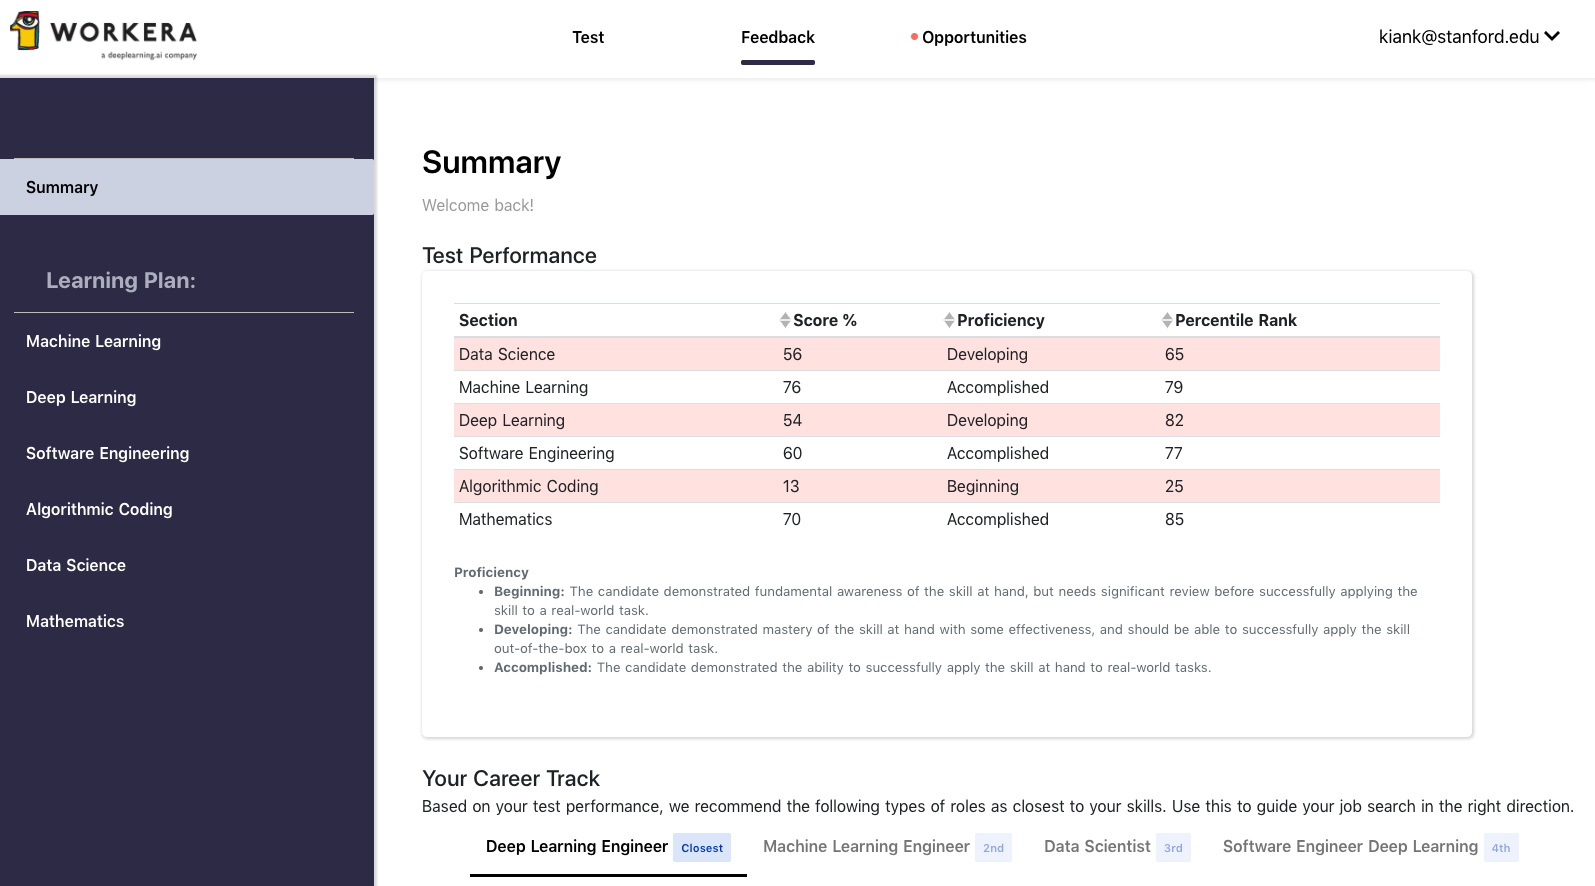
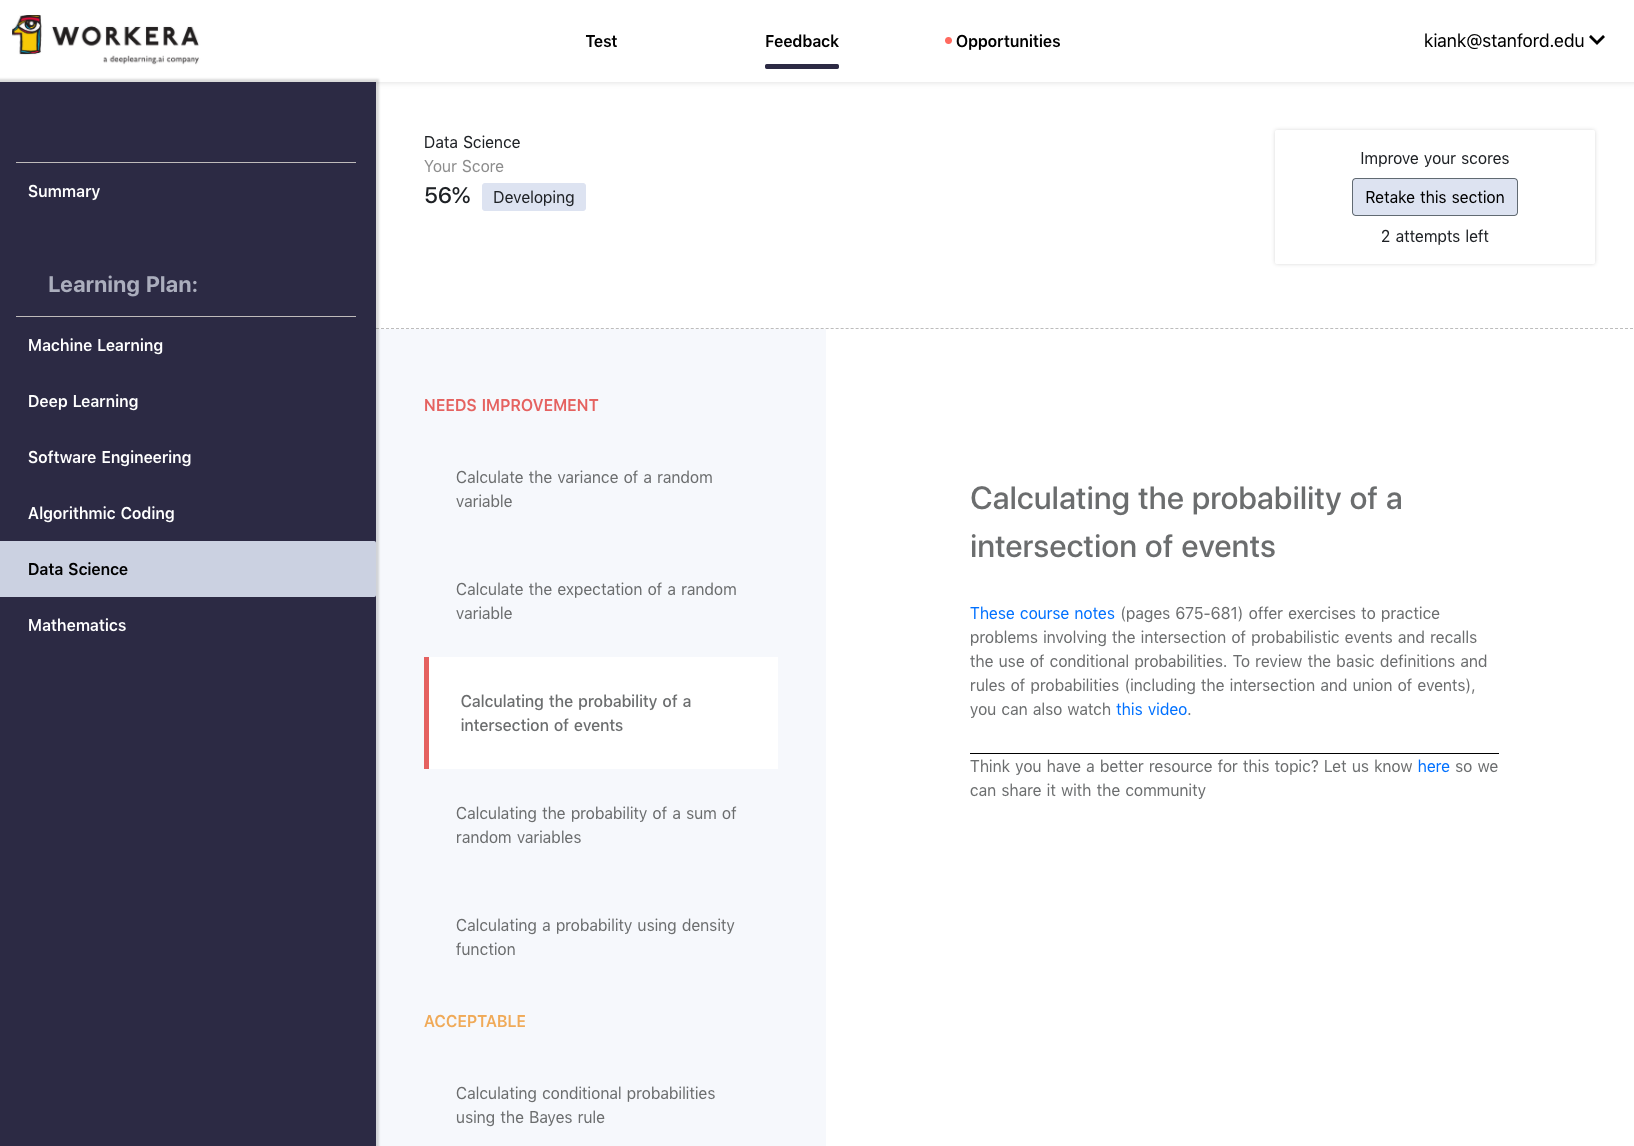
You will also receive feedback for every skills evaluated (e.g., Calculating the probability of a intersection of events or Calculating conditional probabilities using the Bayes rule).
III Data science practice questions
Nothing beats practice! Here are examples of questions you might encounter in the data science test. Think carefully before selecting your answer. Then, click submit to see the answer and get feedback.
Question 1: Classification metrics
Question 2: Residual plots for linear regression
Question 3: Balls in Bags
Question 4: Bernoulli distribution mean and variance
IV Tips for the data science test
Now that you know what to expect in our data science test, it’s time to take it! You can take the test up to three times in a 90-day period (unless the test is being administered to you by a company for a job) and your results are only ever shared with your permission. The first test is simply meant to act as a baseline to show you where to start studying. So why wait? Sign up here to take the data science test.
You are designing a model that diagnoses whether a patient requires high risk surgery or not. Assume that$:$
- the binary label for a patient that needs the surgery is 1 (Positive)
- the binary label for a patient that could use a less aggressive medical treatment is 0 (Negative)
The single most important factor to take into account is that the model should not suggest the surgery option to a patient that could receive alternative treatment.
Which of these accuracy metrics will be the most important to you? (TP means “True Positive”, FN means “False Negative”, FP means “False Positive”, TN means “True Negative”.)
TP/(TP+FP)
TN/(TN+FN)
TP/(TP+FN)
You have trained a linear regression model on a dataset (X, Y) and plotted the residuals $r$ against the predicted values $\hat{y}$. Here is the plot$:$
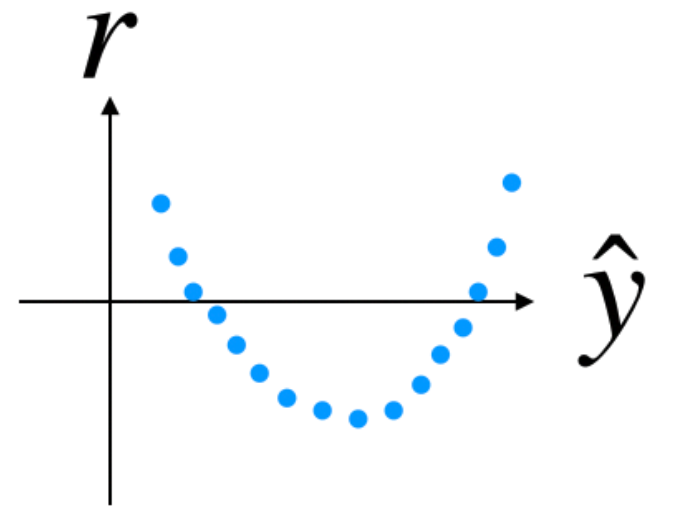
What can you conclude from this plot?
Two or more input variables (features) are closely related to one another, it might be beneficial to apply a dimensionality reduction method such as PCA before applying the linear regression.
There is likely a linear relationship between the input data and the output label. Thus, a linear regression seems appropriate.
There is likely a non-linear relationship between the input data and the output label. Thus, a linear regression doesn't seem appropriate.
None of the above.
Bag I contains 4 white and 6 black balls while another Bag II contains 4 white and 3 black balls. One ball is drawn at random from one of the bags (with 50% probability for each bag) and it is found to be black. Find the probability that it was drawn from Bag I.
8/12
7/12
4/12
5/12
If $X$ is a random variable following a Bernoulli distribution, then $P(X = 1) = p = 1 - P(X = 0) = 1 - q$. Which of the following propositions is true?
$E[X] = 1-p$
$Var(X) = p(1-q)$
$E[X^2] = p$
None of the above
Other tests include machine learning, deep learning, mathematics, algorithmic coding, and software engineering.
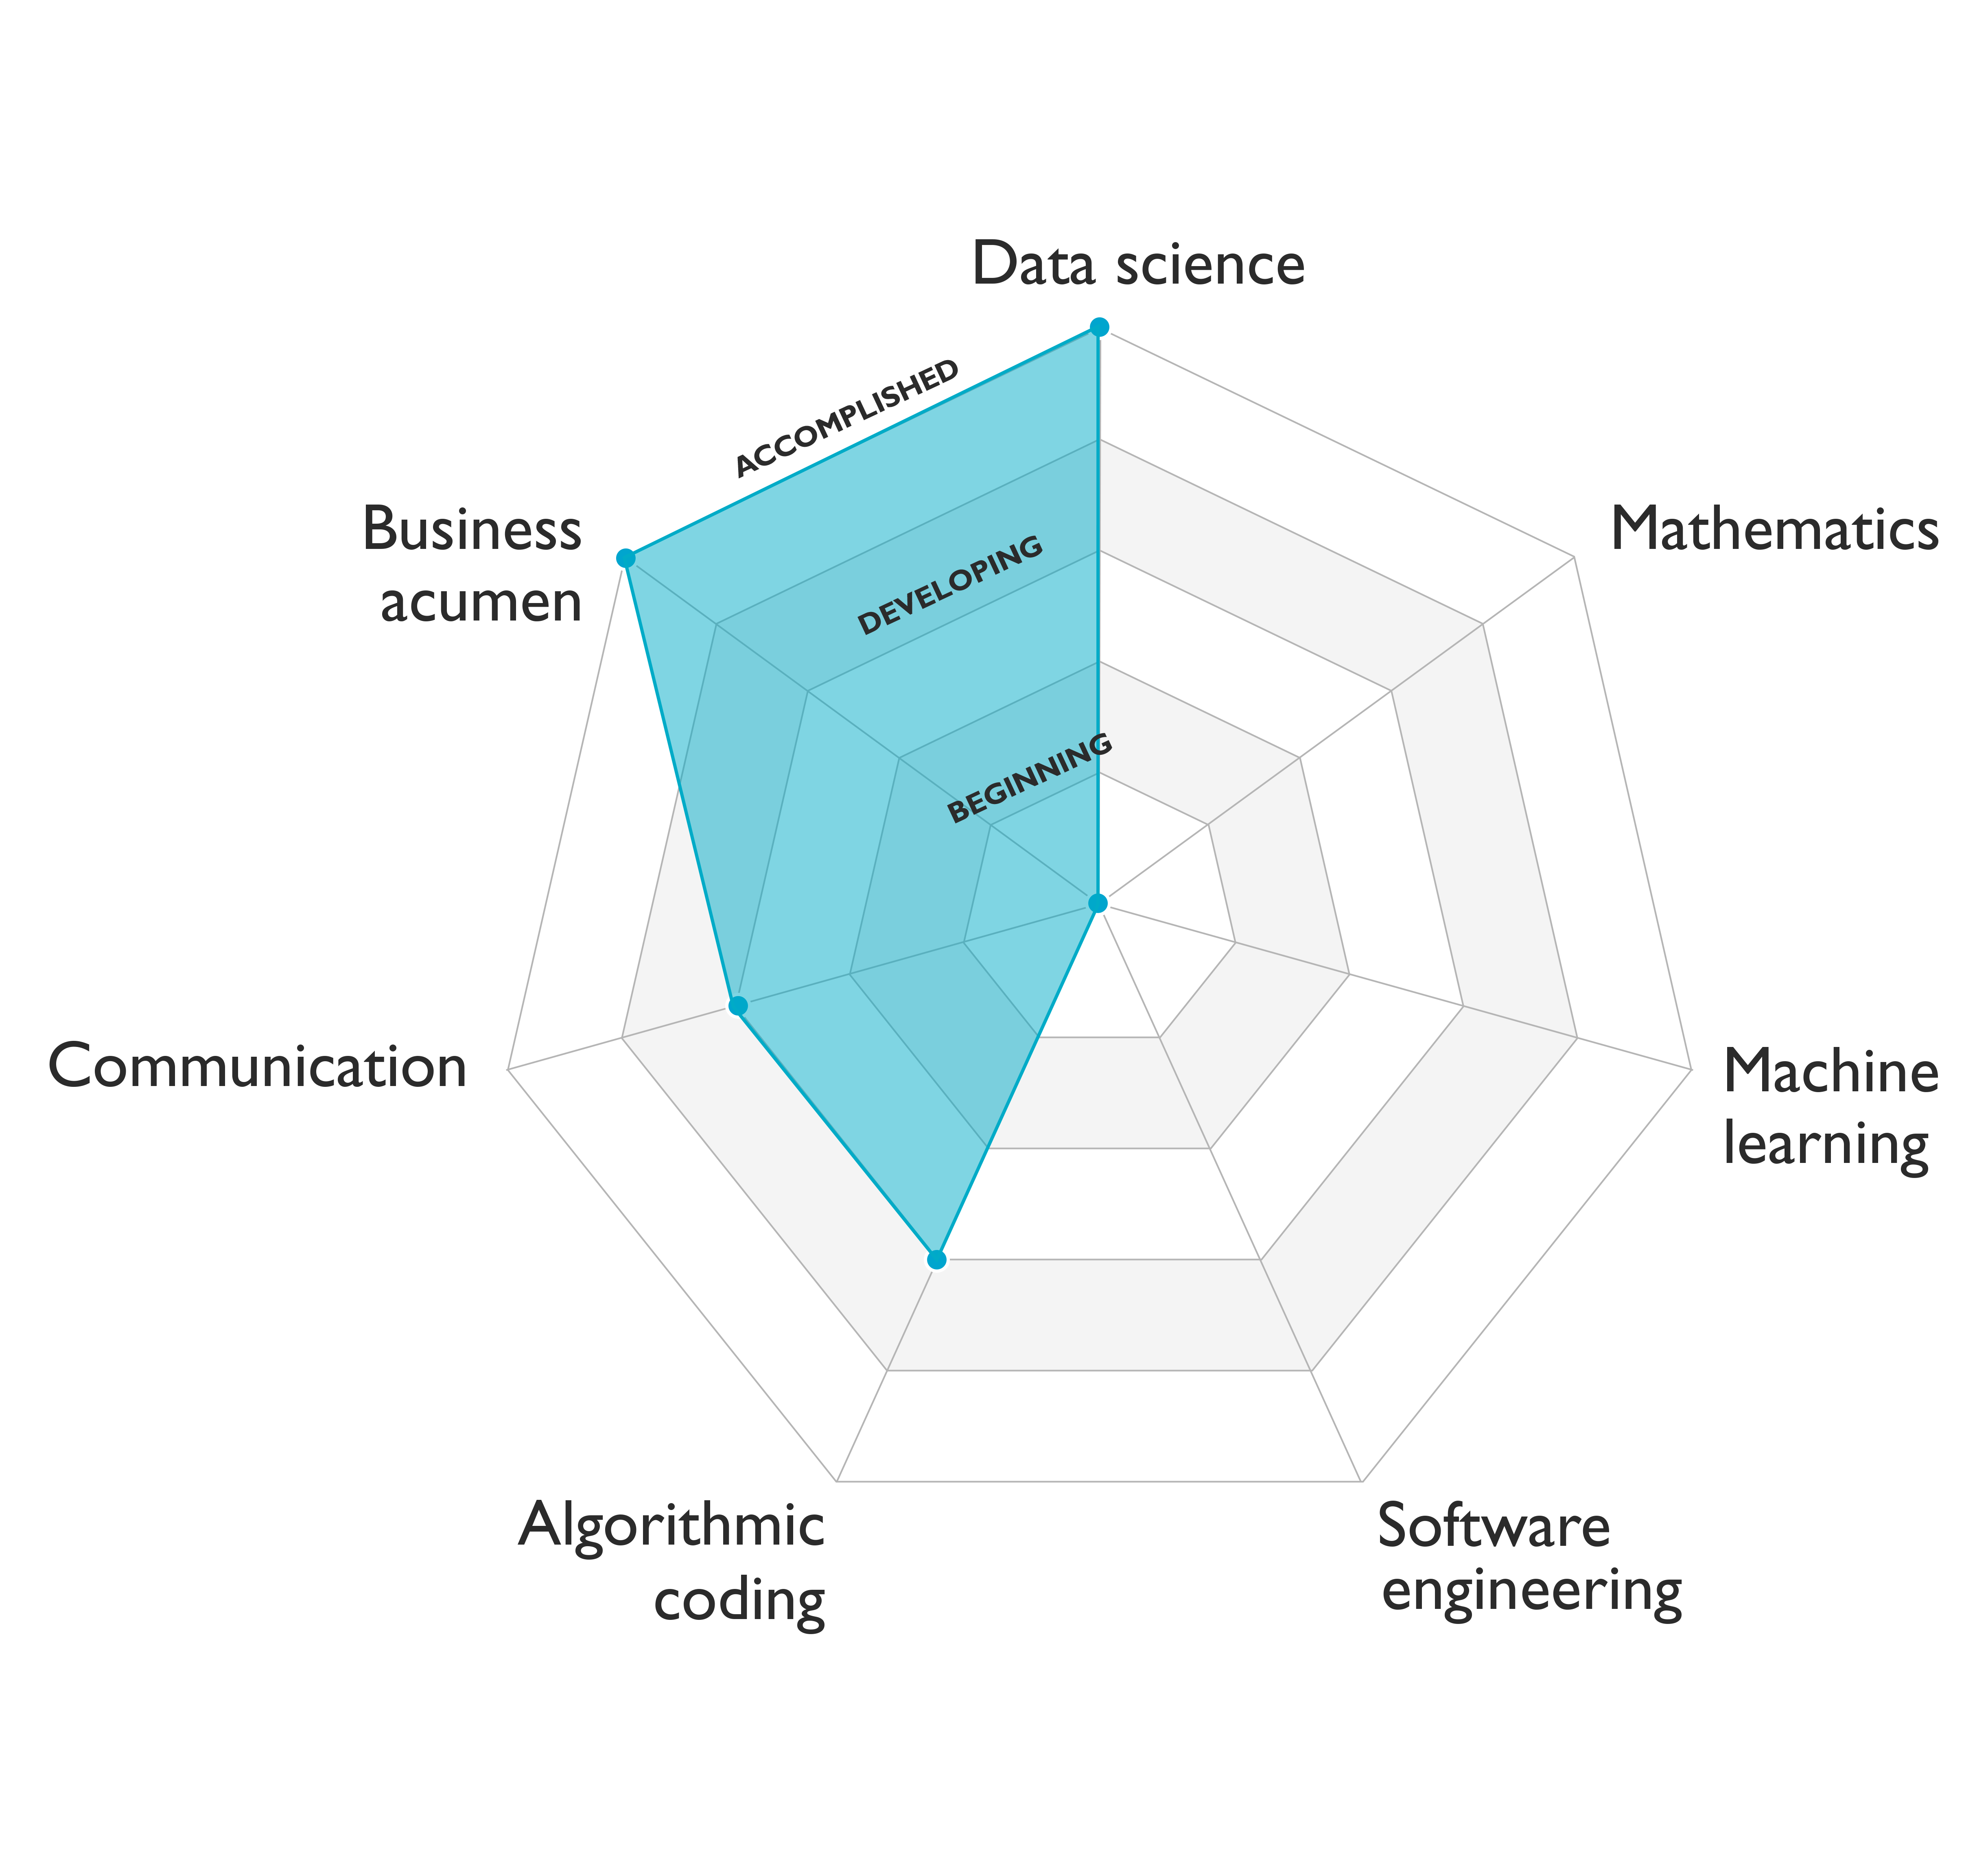
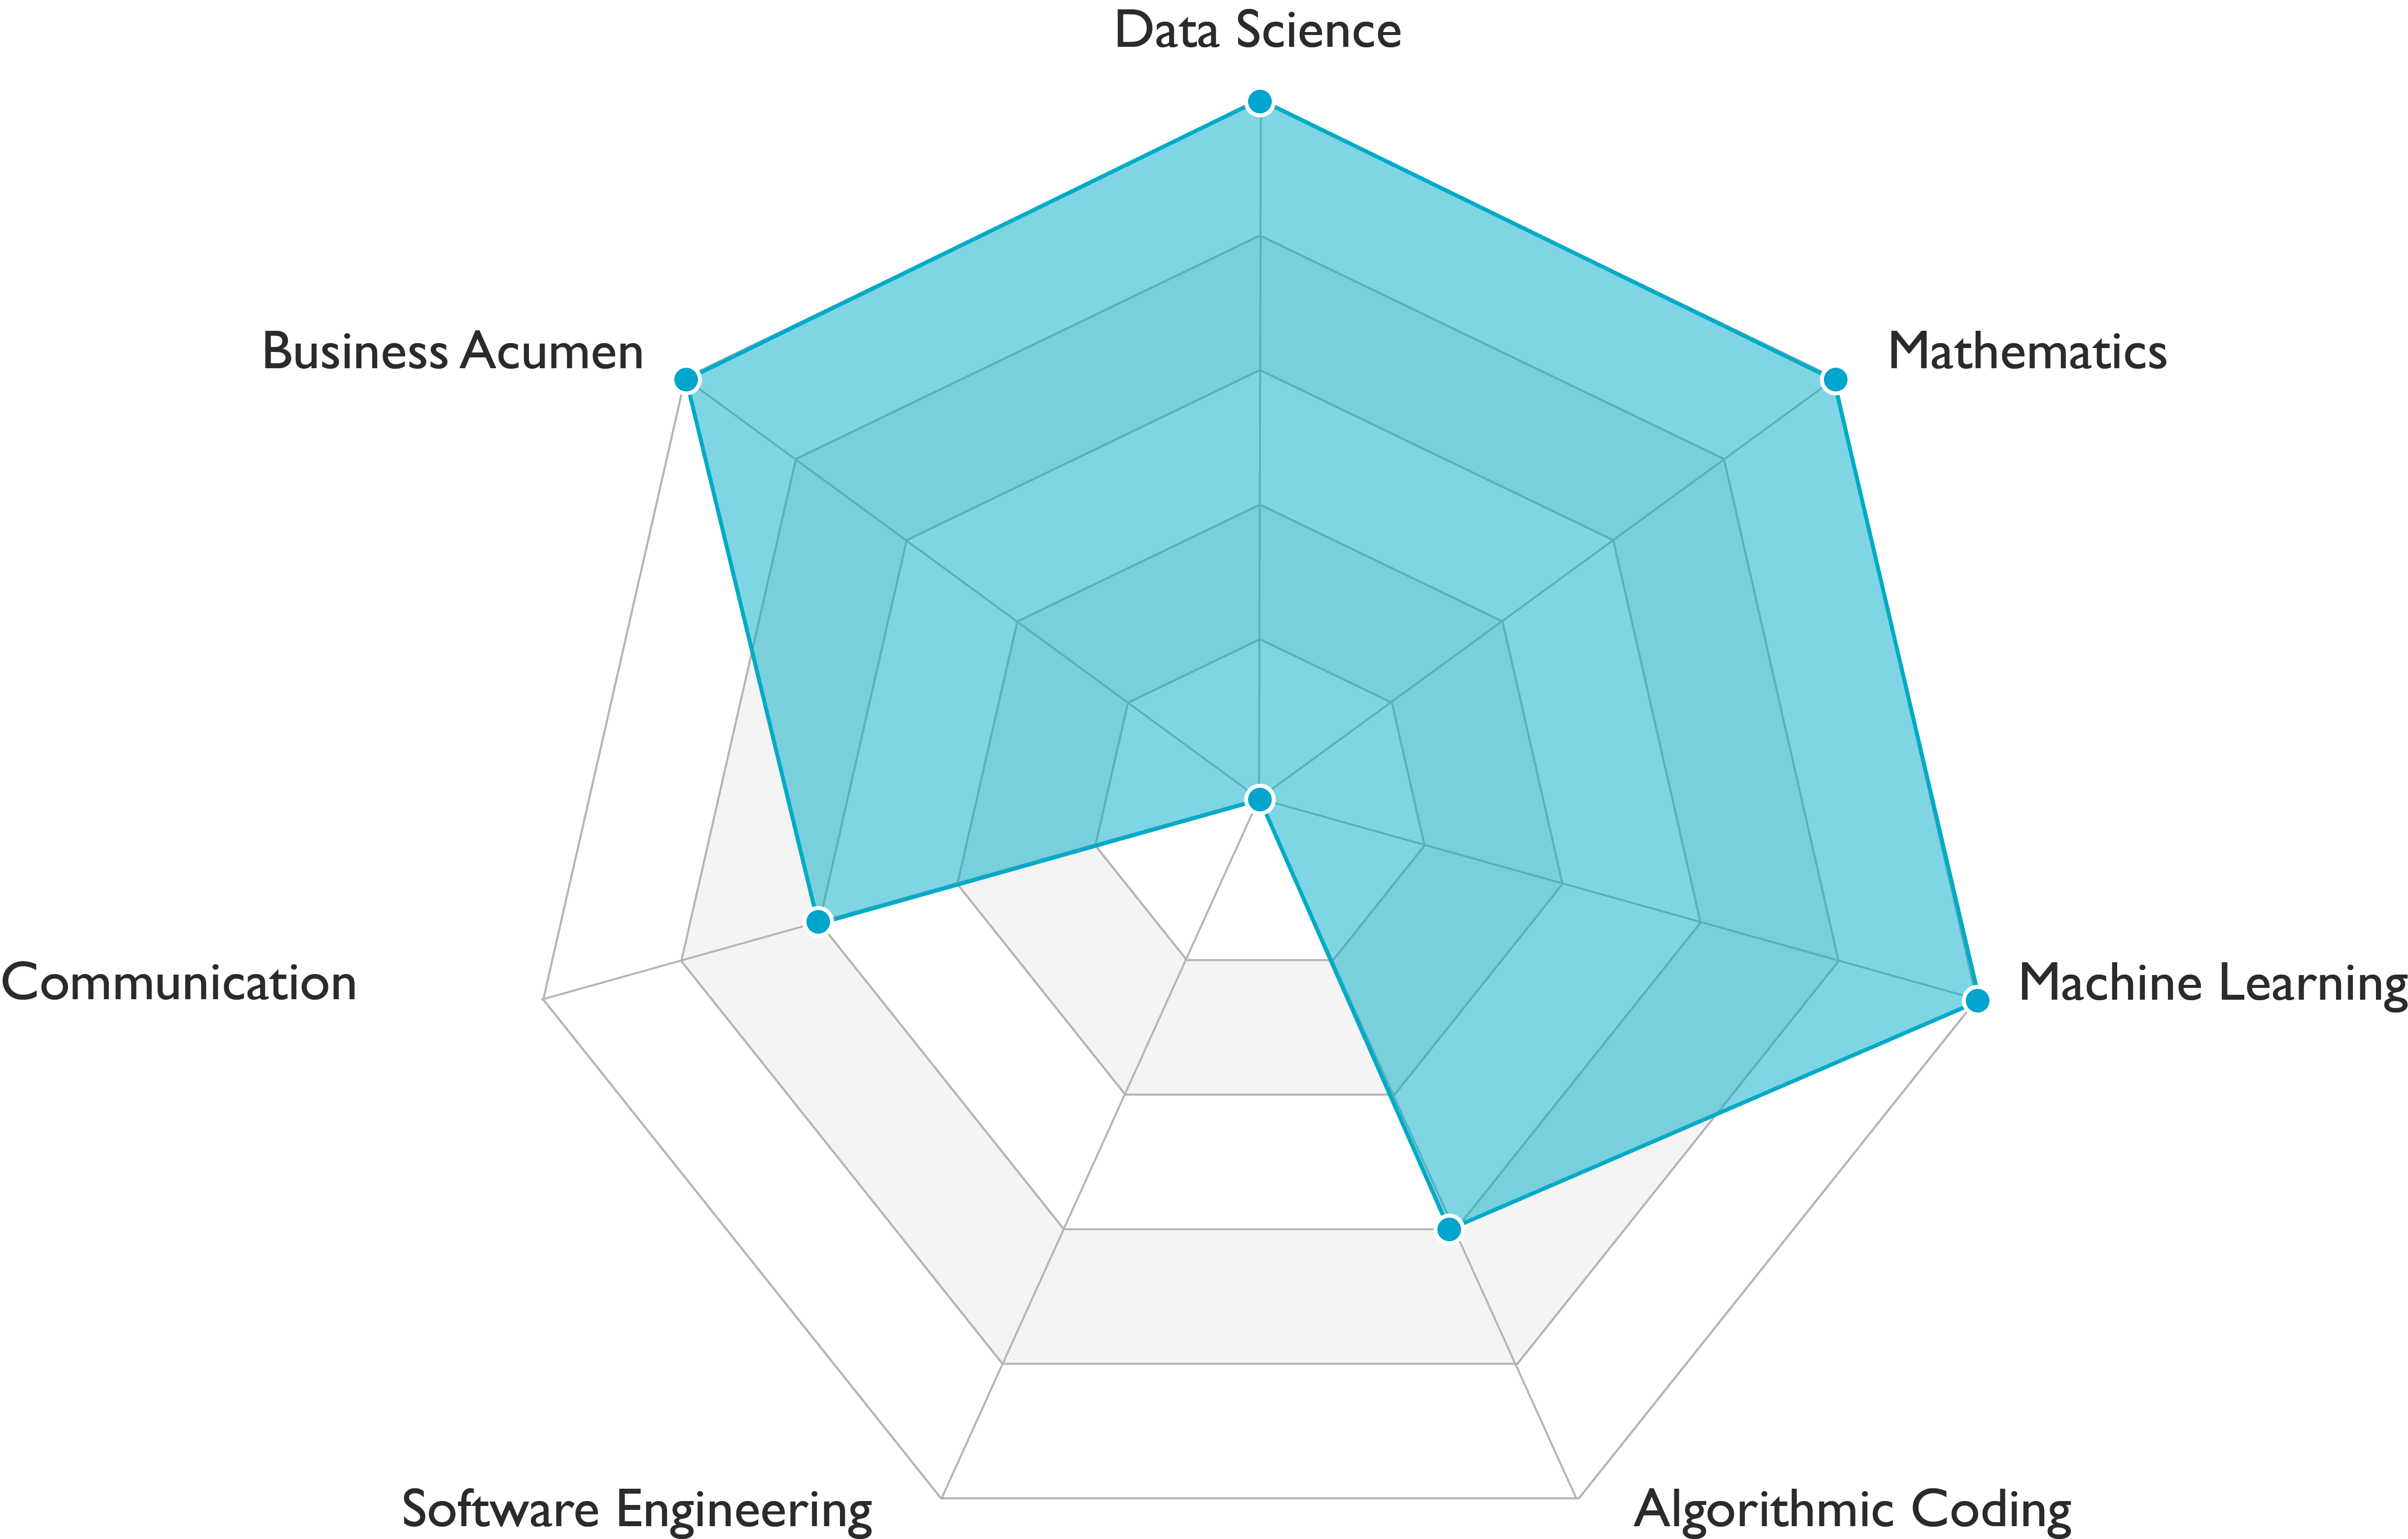 Data scientists carry out data engineering, modeling, and business analysis tasks. They demonstrate solid scientific foundations as well as business acumen (see Figure above). Communication skills are usually required, but the level depends on the team.
 Data analysts cData analysts carry out data engineering and business analysis tasks as shown in the figure above. Their skills complement those of people who train models, deploy them, and build software infrastructure. They demonstrate solid analytical skills as well as business acumen. They are accomplished in query languages such as SQL and commonly use spreadsheet software tools. However, they don’t need algorithmic coding skills. Communication skills are usually required, but the level depends on the team.
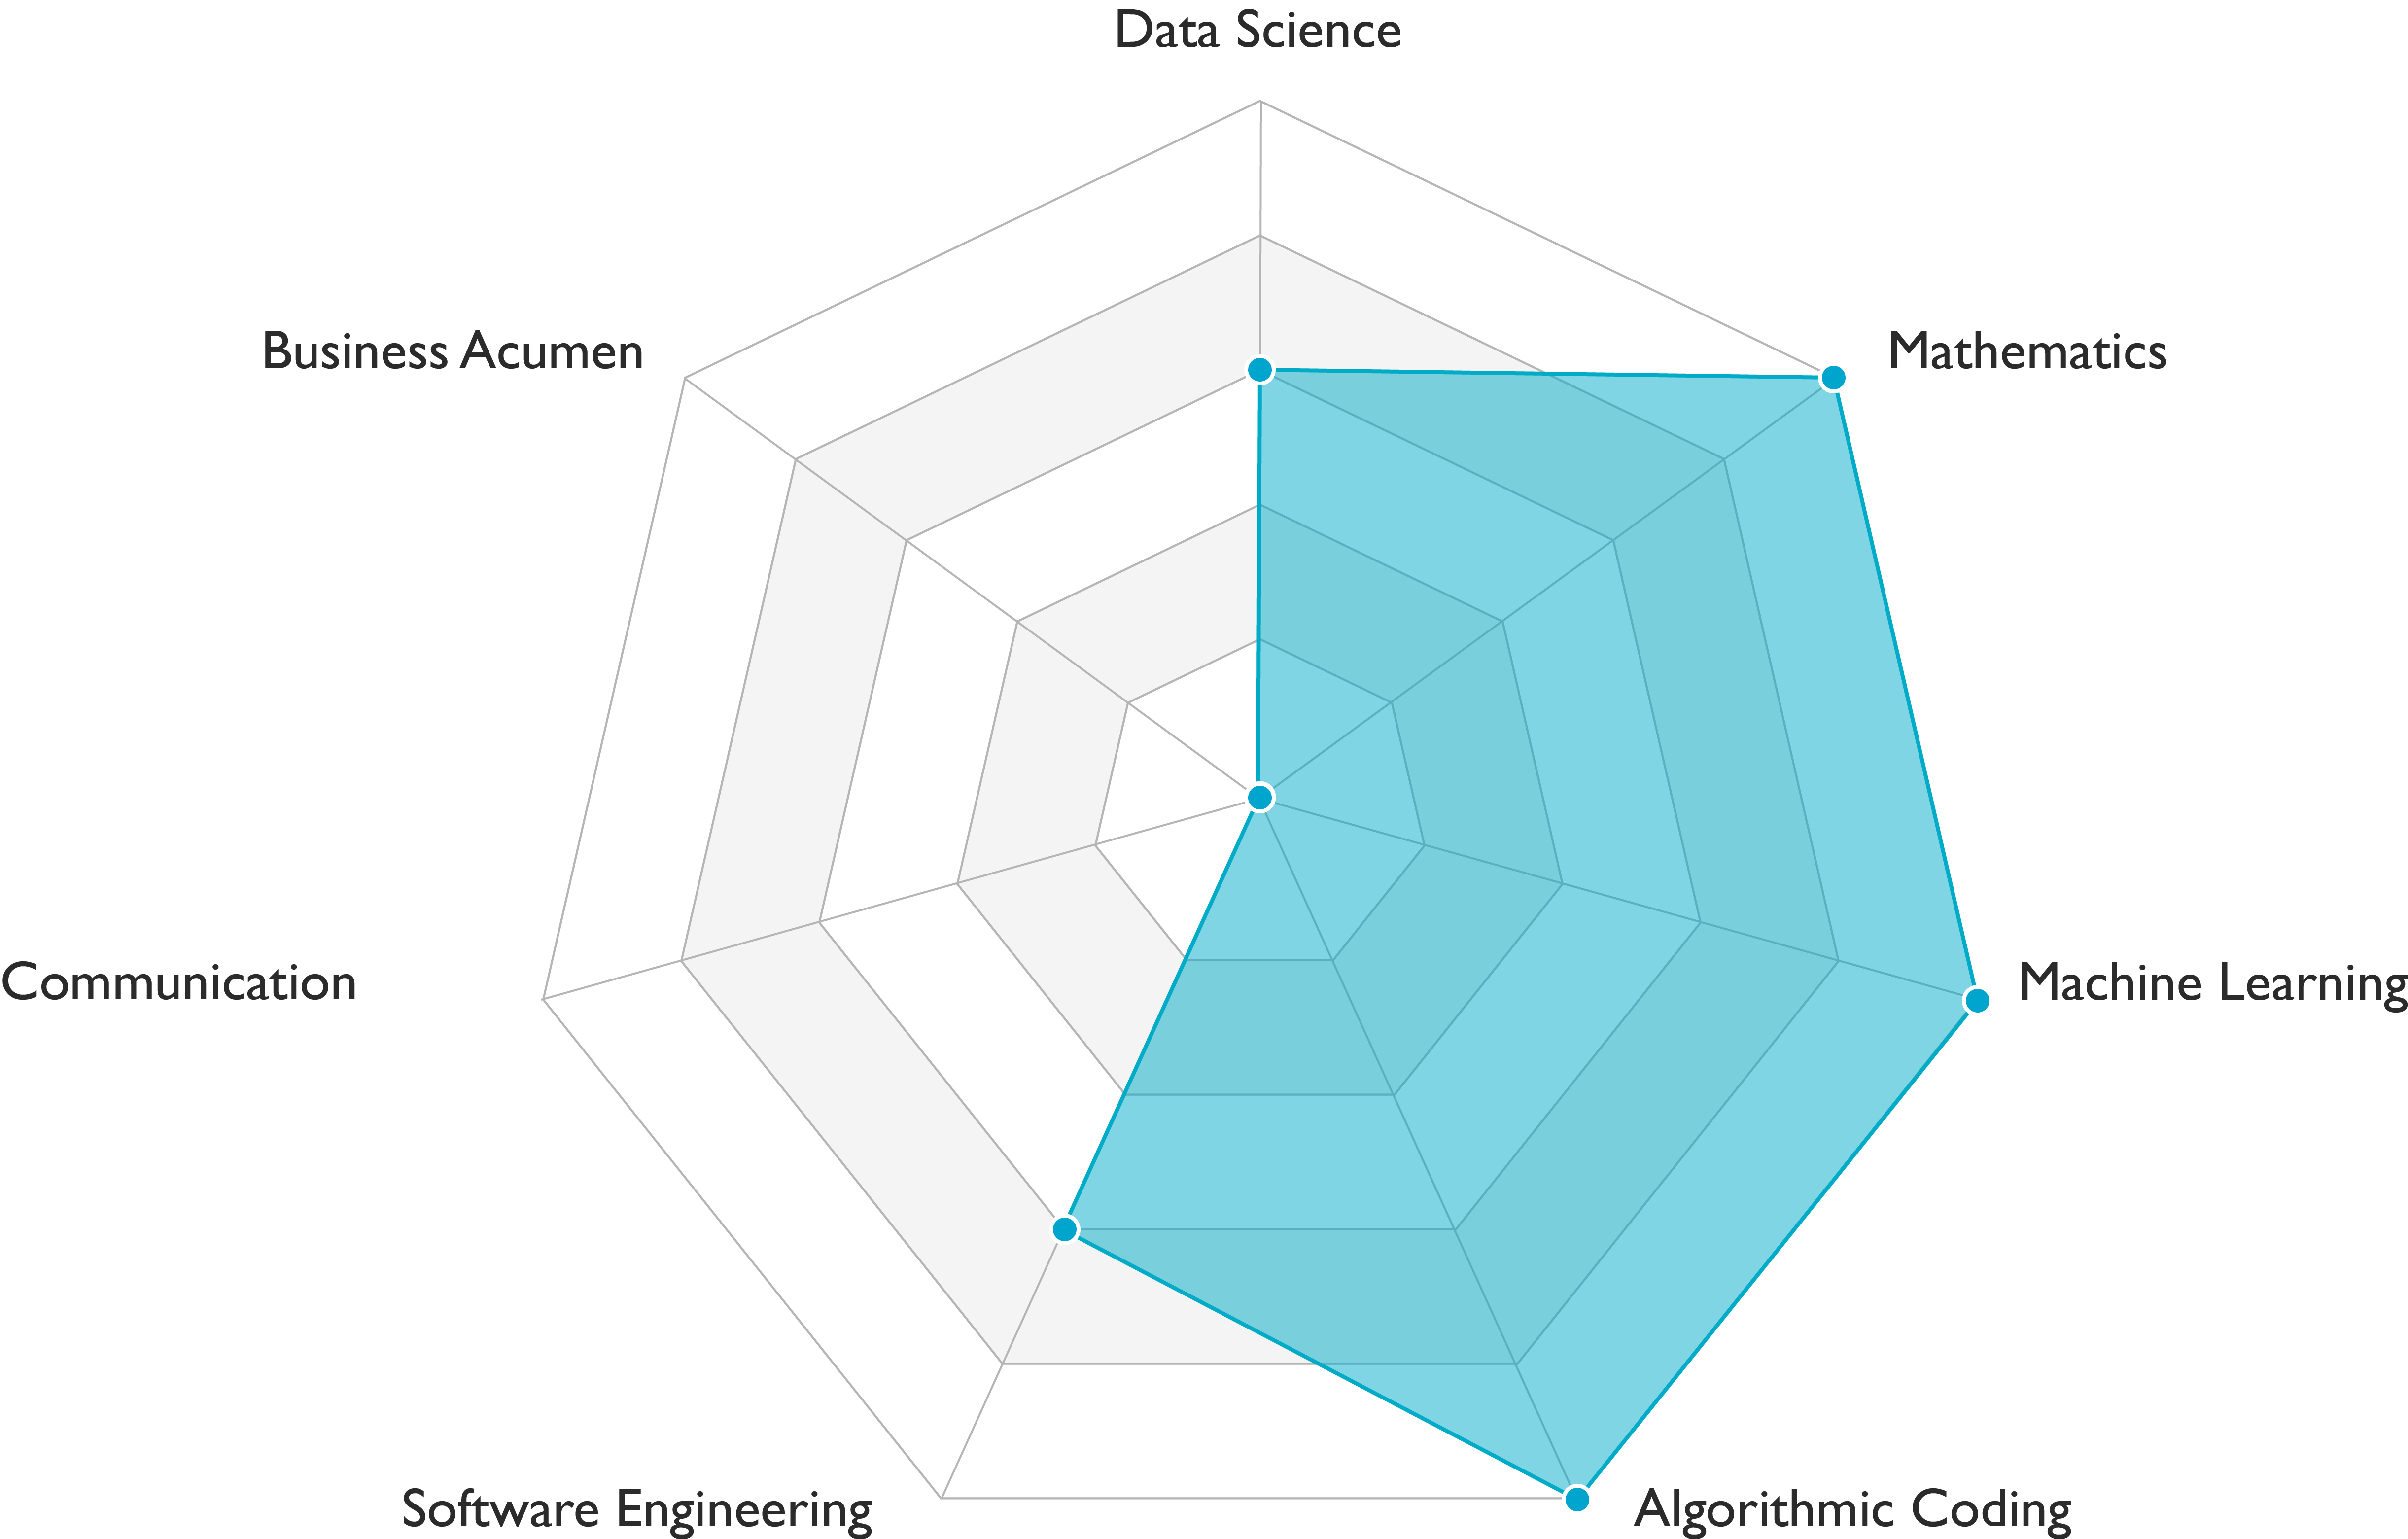 Machine learning engineers carry out data engineering, modeling, and deployment tasks. They demonstrate solid scientific and engineering skills (see Figure above). Communication skills requirements vary among teams.
 Deep learning engineers carry out data engineering, modeling, and deployment tasks. They demonstrate solid scientific and engineering skills. Communication skills requirements vary among teams. This role is a variant of machine learning engineer. It requires deep learning skills in addition to the skills profile presented in the figure above.
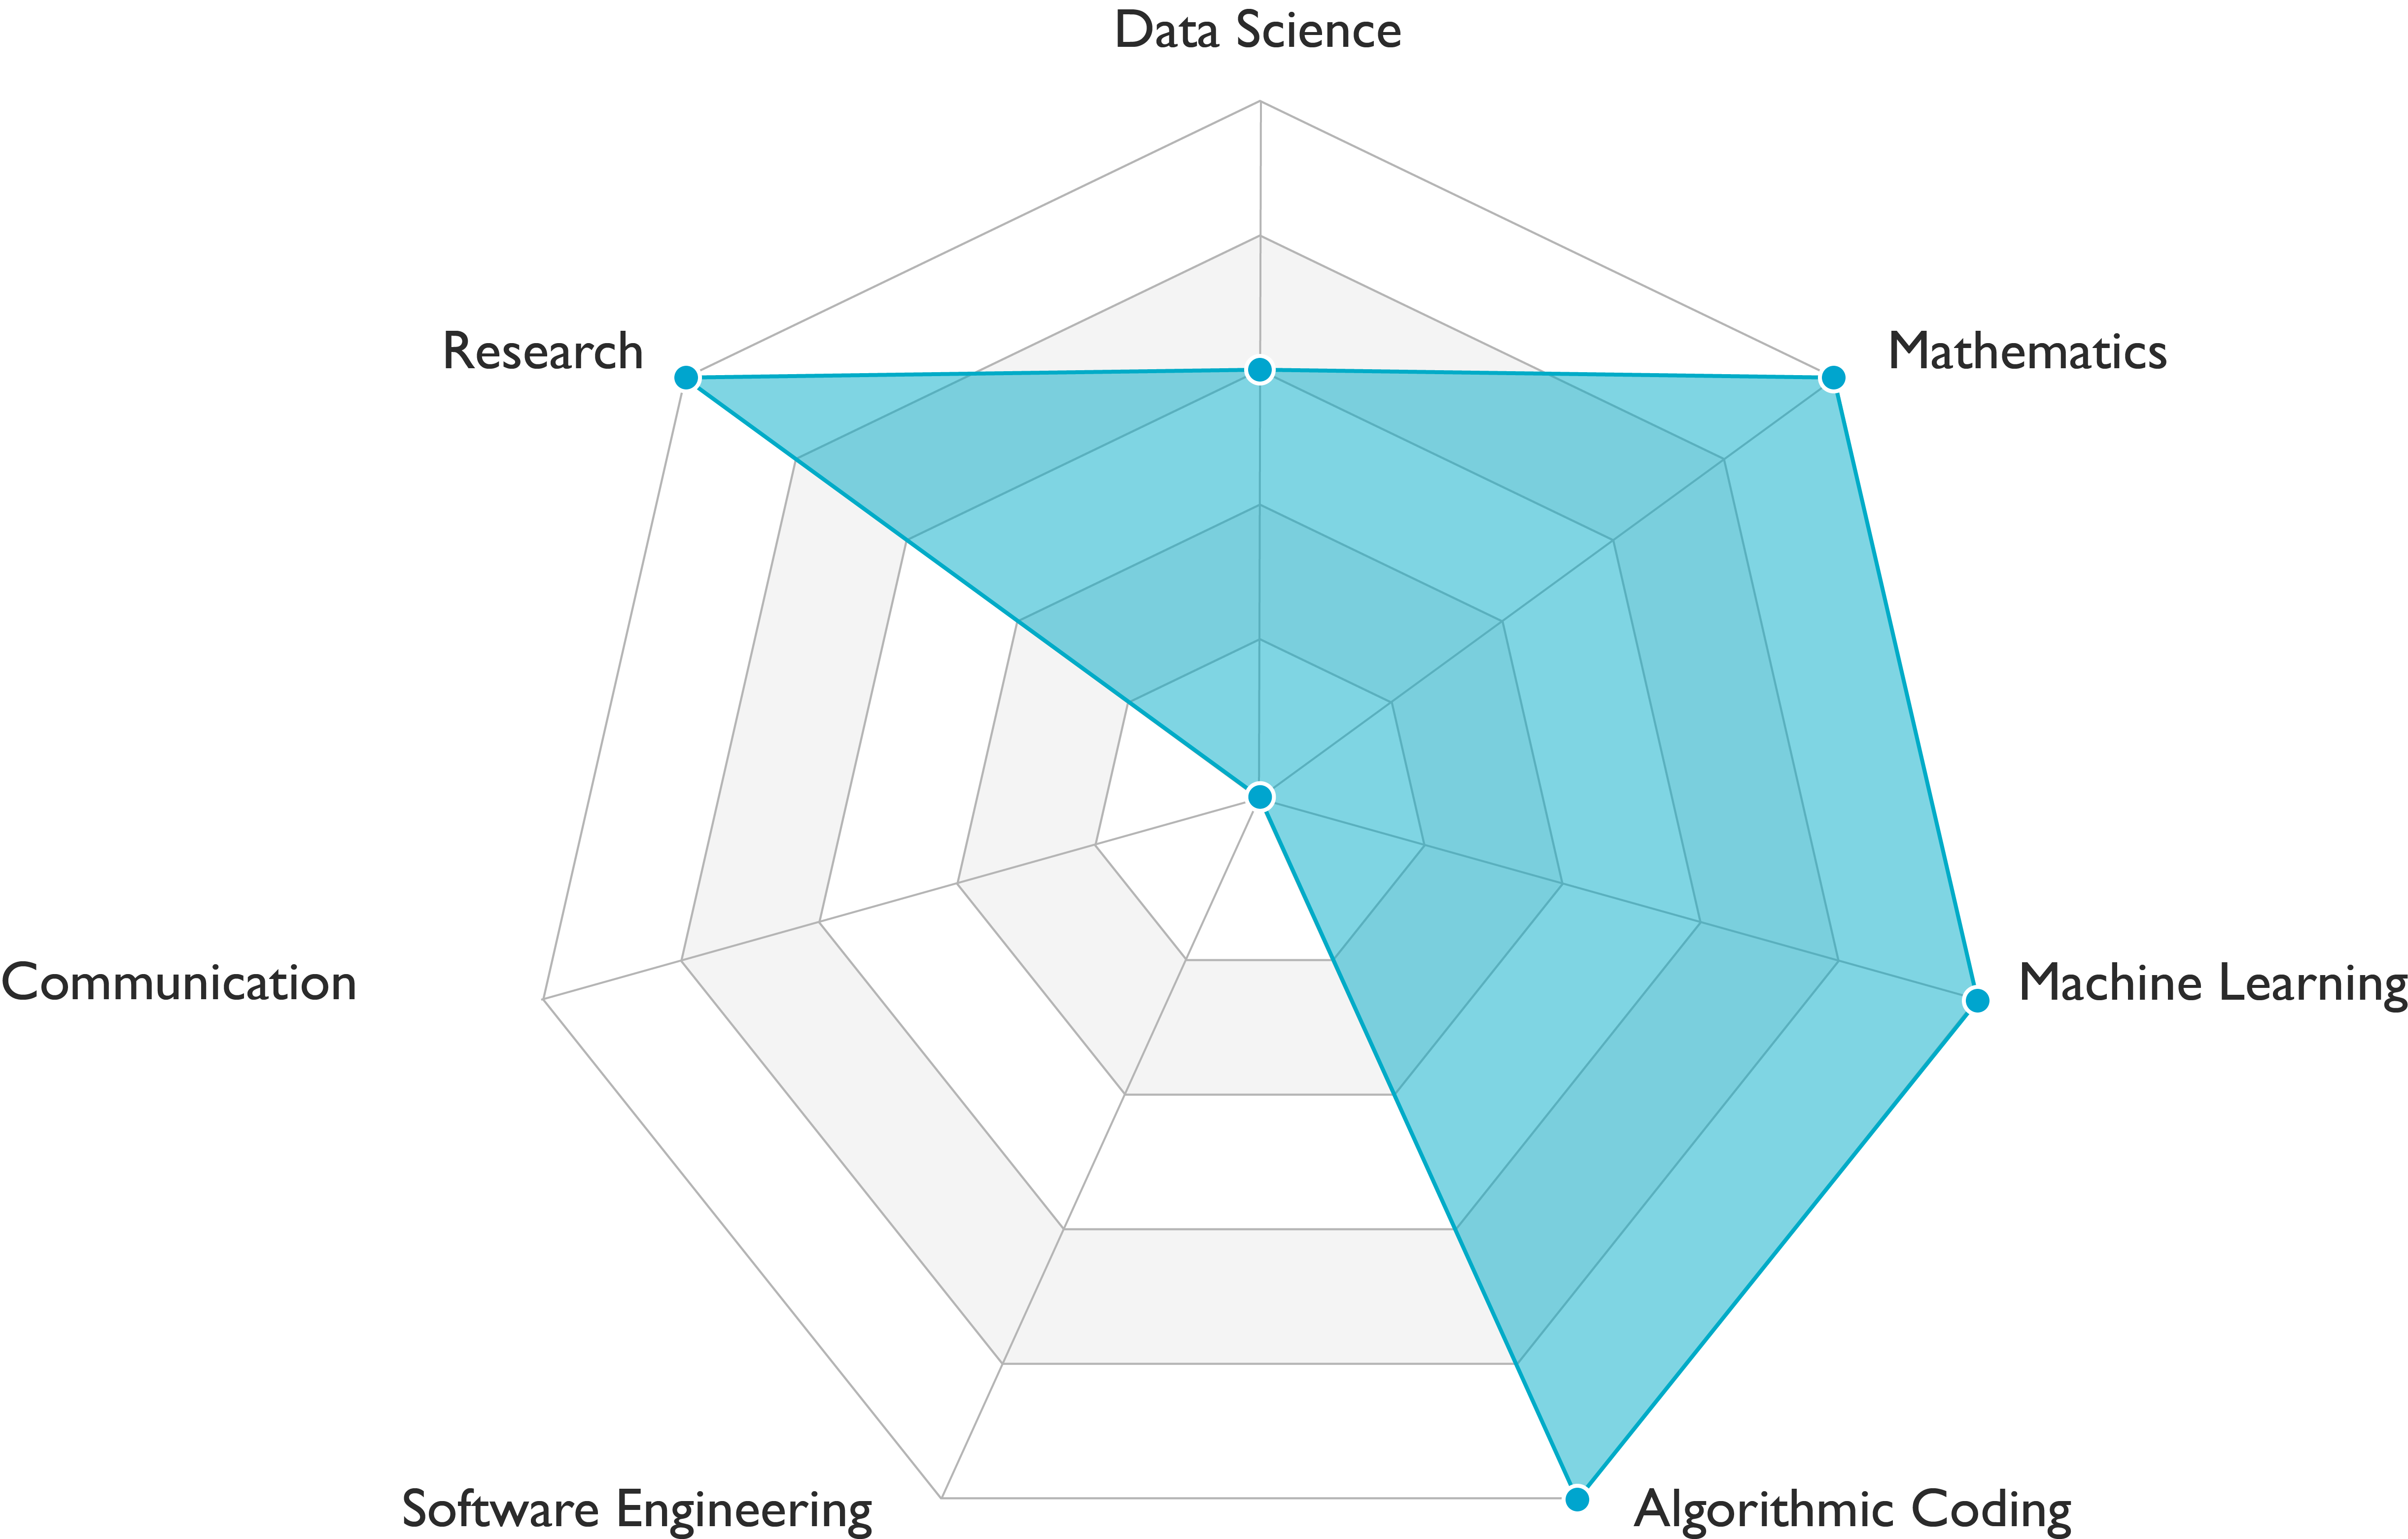
 Machine learning researchers carry out data engineering and modeling tasks. They demonstrate outstanding scientific skills (see Figure above). Communication skills requirements vary among teams.
 Deep learning researchers carry out data engineering and modeling tasks. They demonstrate outstanding scientific skills (see Figure above). Communication skills requirements vary among teams. This role is a variant of machine learning researcher. It requires deep learning skills in addition to the skills profile presented in the figure above.


